OIXIO | HR Reporting
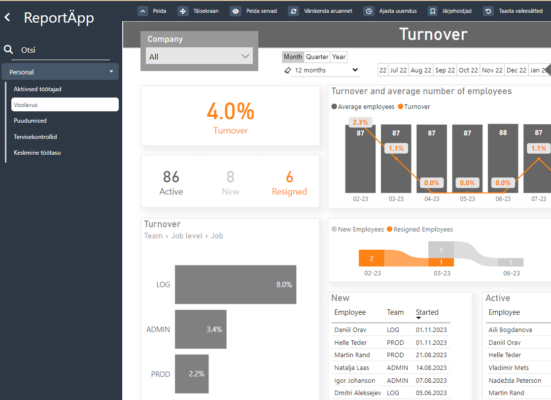
How many employees do we have? Who joined the company last month? How many left? What is the employee turnover rate?
Labor costs account for a significant portion of a company’s expenses, typically ranging from 20% to 75%. This substantial figure prompts a desire to delve deeper into the specifics behind these costs.
That’s precisely what labor reporting aims to achieve. The purpose of reporting is to provide essential information for daily management decisions, benefiting the HR department, management, and the employees themselves.
OIXIO BI Product advantages
Always accessible
Active users
Clicks per month
Dedicated BI gurus
Problems
Difficulty to receive needed information
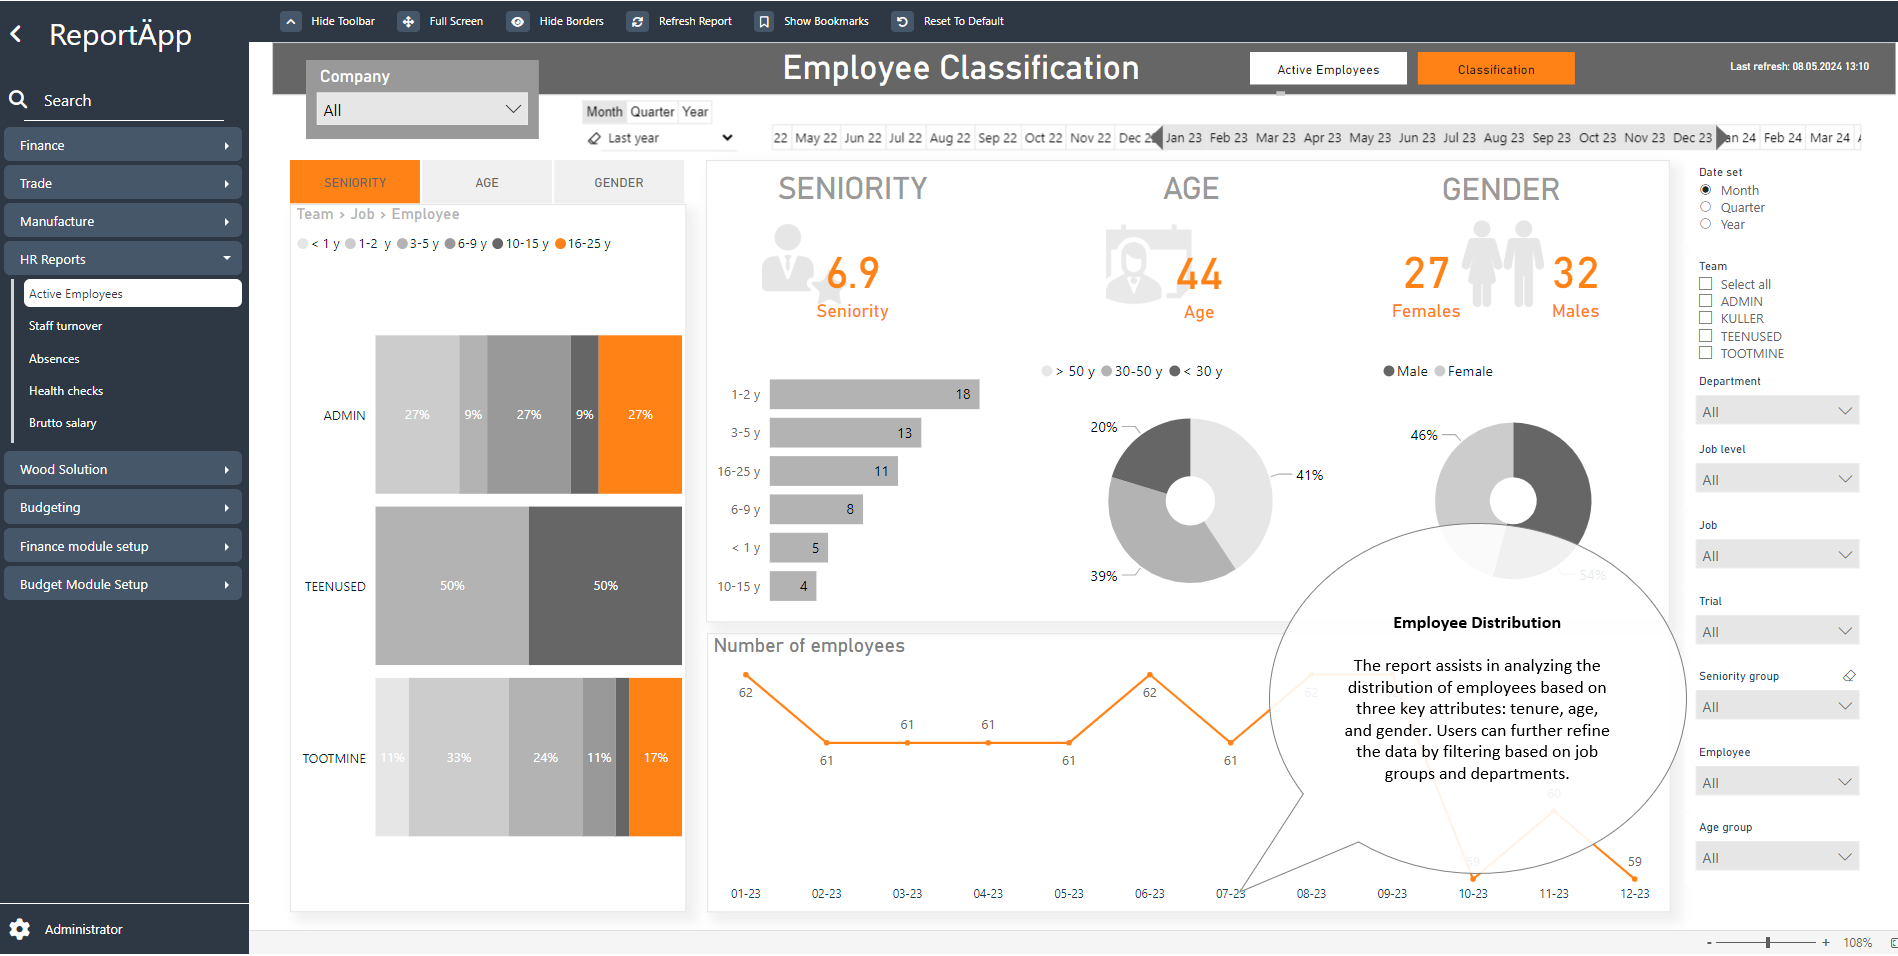
All data is meticulously collected and stored in the HR/Payroll accounting software. However, when a personnel-related question arises—such as how many employees under 30 have a higher education—the answer is very hard to get
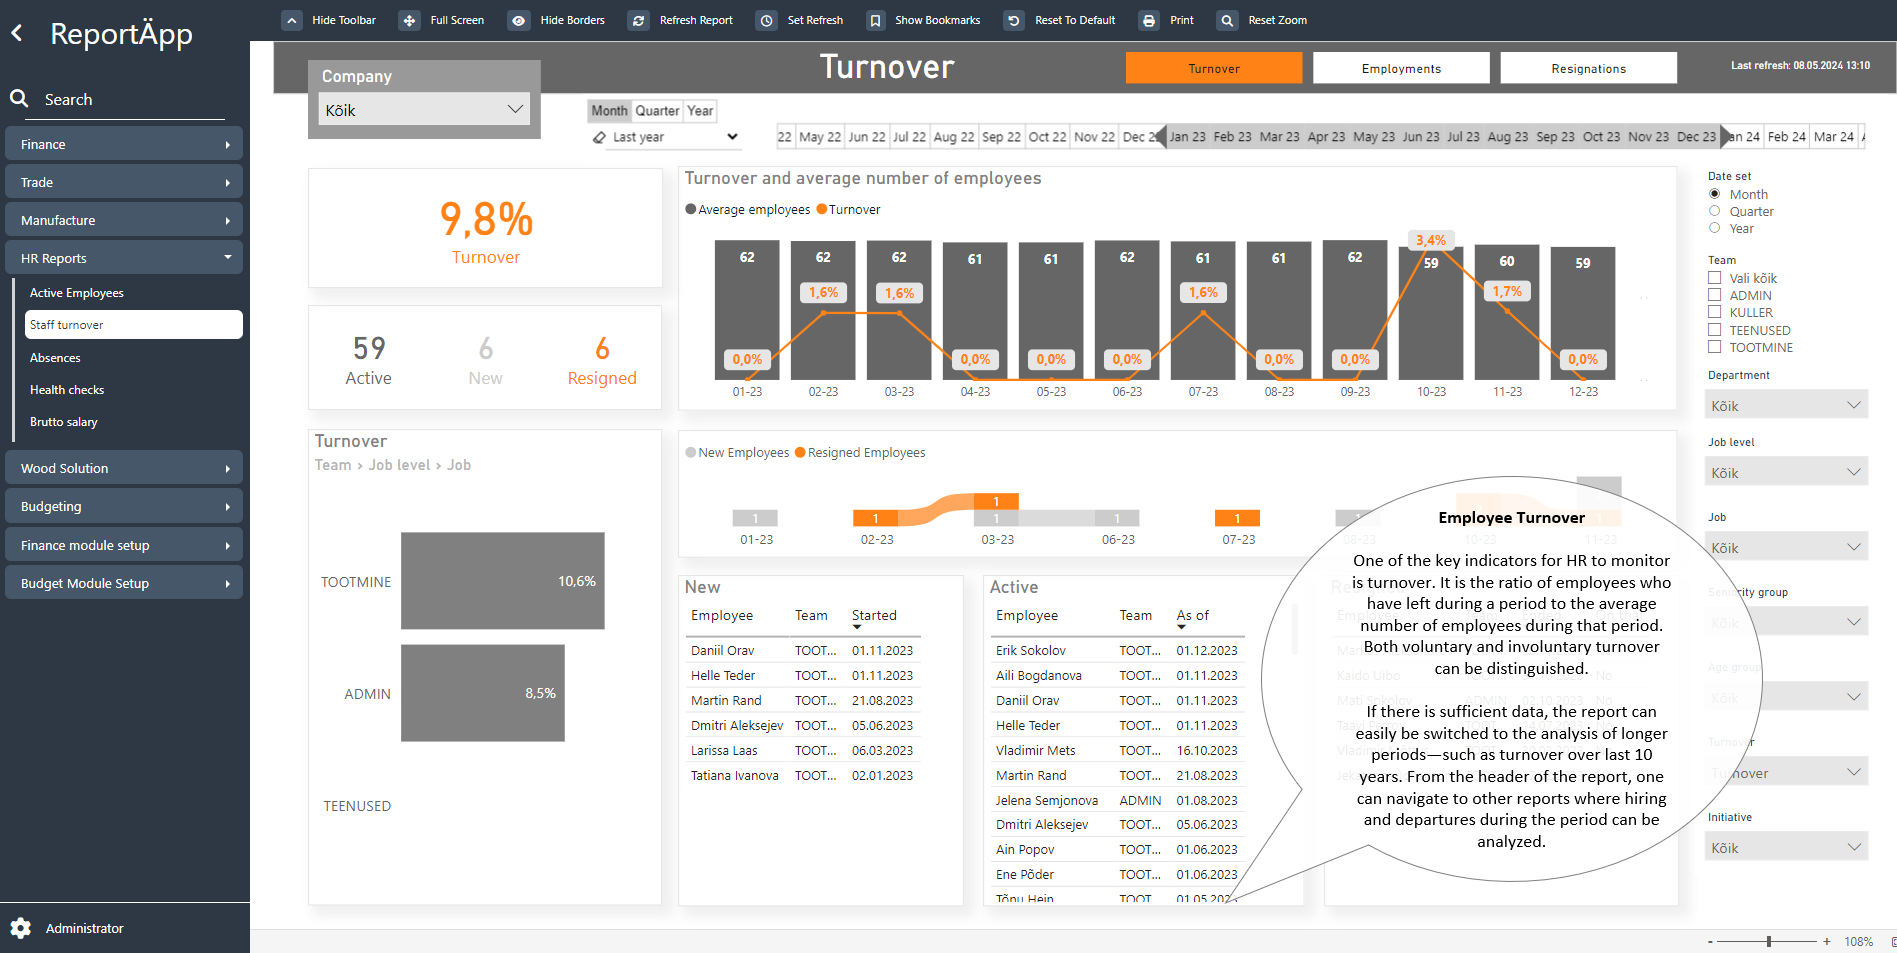
Lack of a centralized monitoring system for KPI’s
The company’s strategy includes agreed-upon HR metrics—such as turnover rates. However, there is no mechanism to measure and track these metrics continuously. Often, the solution involves manual work and Excel spreadsheets!
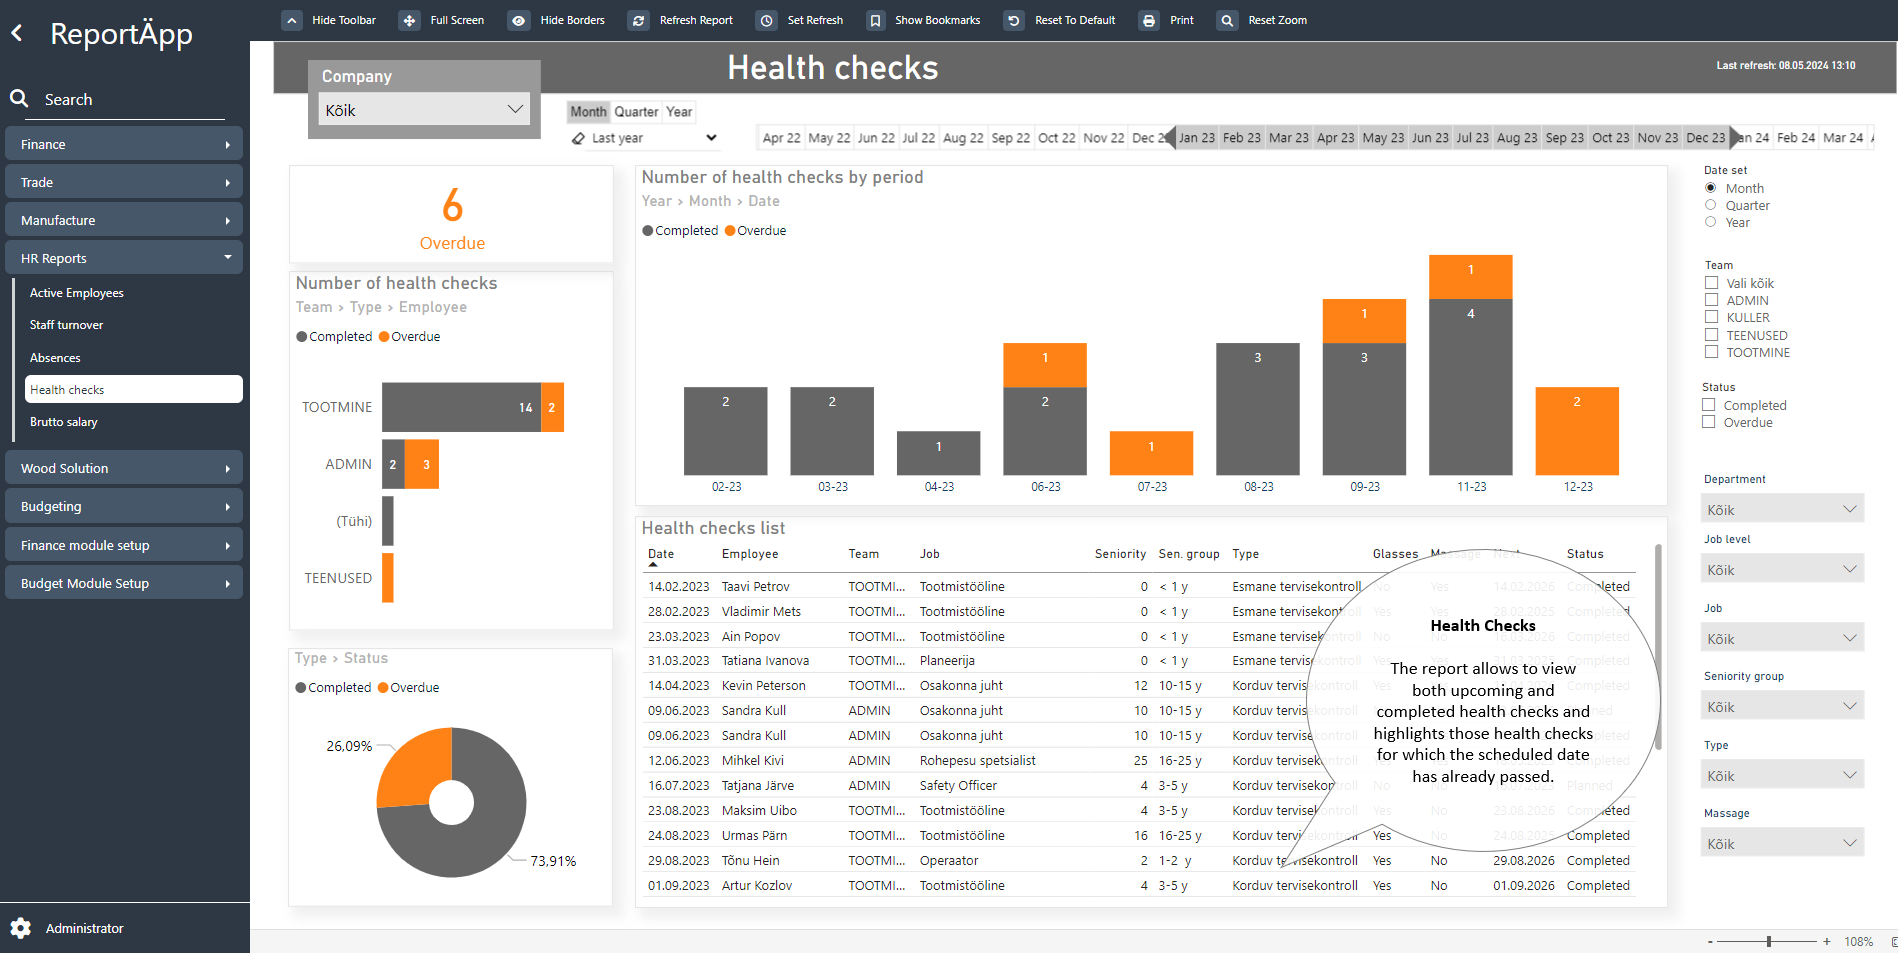
Data is spread across multiple locations
Reports in the HR/Payroll accounting software only work with the data contained within that system. Still, important labor-related information exists in various other software or files. There is a need to consolidate data from different sources into one report.
Solutions
Always Accessible!
All reports are conveniently just a click away—accessible directly from a web browser. The data is always up to date, and when a report is opened, the user sees the most current status.
Monitoring KPI’s
The reporting package serves as a hub for tracking agreed-upon metrics, even in real time. This is where “one truth” resides, free from disputes.
Benchmarking data
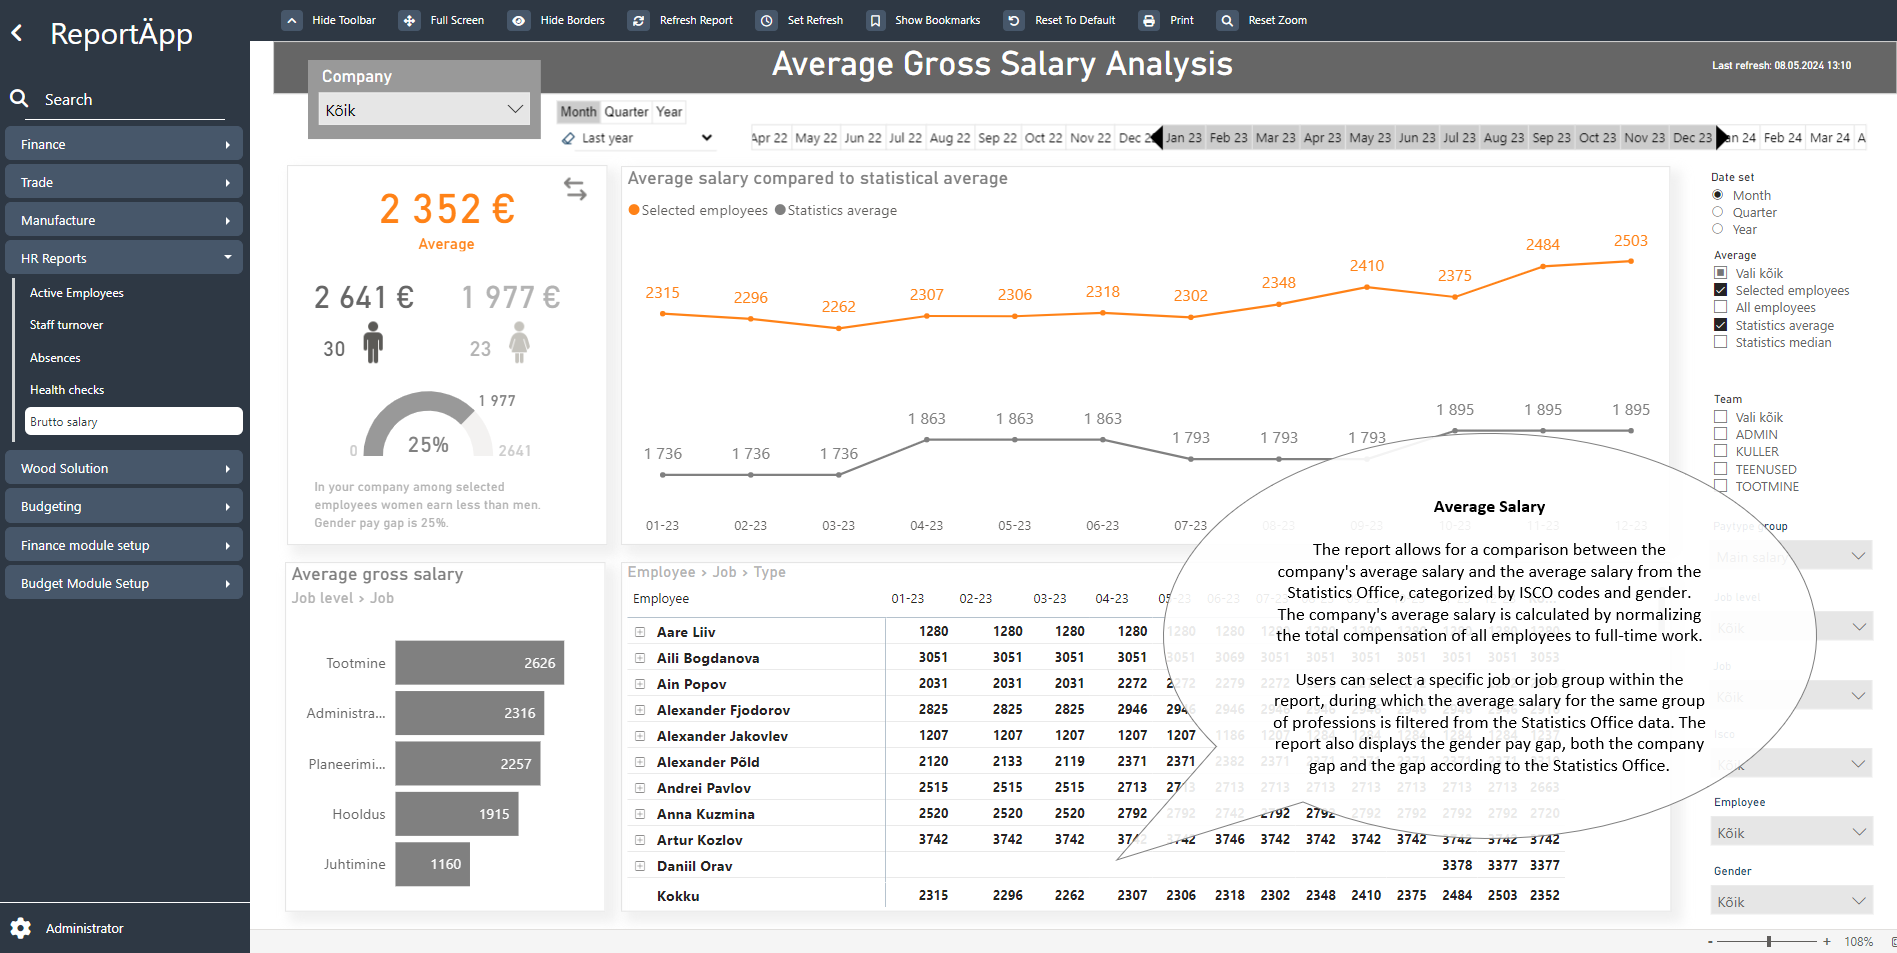
The reporting package aggregates data from various sources. For example, we have included average salary data from the Statistics Office, categorized by occupation and gender. When compared to the average salary data of the company’s employees, this provides valuable insights for analyzing payroll expenses.
How to set up reporting?

1. 1. DATA We will agree on where to source the necessary data and how the reporting solution will access it..

2. INTEGRATION We will automate data collection and transform it into a suitable format for reporting.

3. REPORTING We will make reports available to users. If needed, modifications can be made, or new reports can be added,

4. USAGE The solution will serve as a daily tool for users, ensuring that they always have access to accurate and up-to-date information.
LOOK AHEAD!
See examples of reports in our gallery – click on the image to open it above the screen.

Watch the product video!
A video overview of the possibilities our reporting package offers for analysing the workforce.
Customers of OIXIO BI products