OIXIO Finance Reporting
What is the turnover for this month?
How are sales progressing across business areas and product groups?
Are we profitable?
How are we doing compared to the budget?
And I want to see the details! Where is the money coming from, and why is it going so quickly?
Successful companies manage their revenues and expenses. They set goals and measure their achievement. A financial reporting solution delivers the necessary information to decision-makers at every level. Automatically!
Fresh data on the situation every hour. One source of truth, from the big picture down to the last detail. Intuitive and convenient, dynamic and rich with information. View data by group, company, department, product line, or customer. As of current month, year to date, or since the beginning of time. Comparisons with goals, forecasts, and previous periods. Key performance indicators and target values.
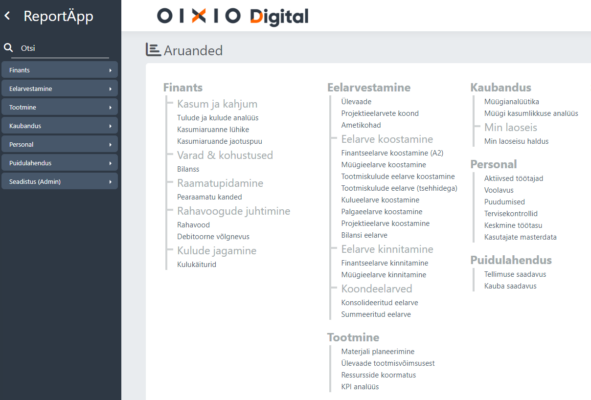
OIXIO BI toodete eelised
Always accessible
Active users
Clicks per month
Dedicated BI gurus
Problems
Management reporting is both the CFO’s monopoly and a
millstone around the neck
Compiling financial results into a presentation-worthy format is a time-consuming manual task, done every month. Real-time results are rarely visible. Gathering information by business units and product lines is too labor-intensive. Detailed entries remain a distant dream.
Every manager has their own version of the truth
For meetings, managers arm themselves with Excel sheets that present the data in the most convenient way. The decision-making process often grinds to a halt, bogged down in debates over whose version of the truth is the real one.
No centralized place to track key metrics
The company has strategic key performance indicators (KPIs), but there is no way to continuously measure or monitor them. Often, the solution ends up being manual work and Excel.
Data is scattered across different places
Comparing goals with past periods is complicated because the data is somewhere in Excel. The reports within the accounting software only work with the data it contains, but important information also exists elsewhere—such as in other software or files. There is a need to consolidate data from various sources into a single report
Solutions
Always accessible and automated
management reporting
Automated management reporting works on its own! All reports are conveniently just a click away—accessible directly from the web browser. The data is always up-to-date, and when the report is opened, the user sees the most recent state.
One source of truth, from the big picture to the details
Unified and automated data from original sources. Agreed-upon metrics, target values, comparison rules, and report views. This allows us to focus on analyzing facts and making decisions
Tracking key performance indicators
The reporting package is the place to monitor agreed-upon metrics, even in real time. Here lies the “one truth,” which is not subject to debate.
Comparison data
The reporting package brings together data from various sources. Actual results from accounting software, budgets from Excel or OIXIO’s budgeting solution, and so on.
EXPLORE FURTHER!
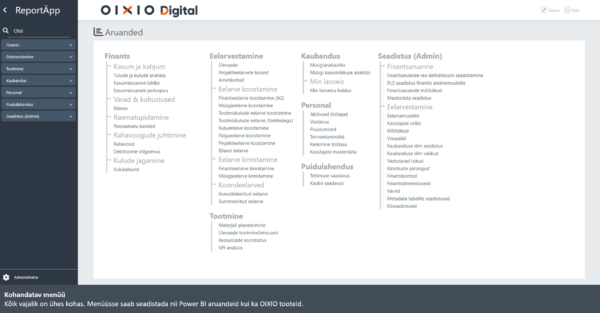
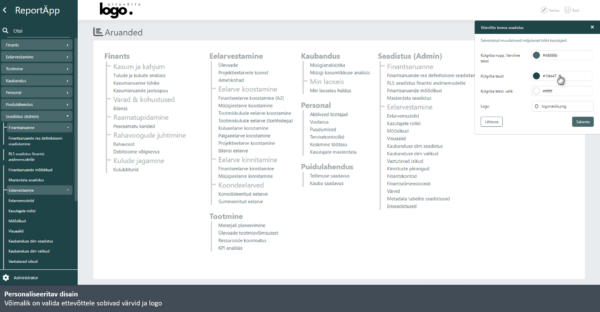
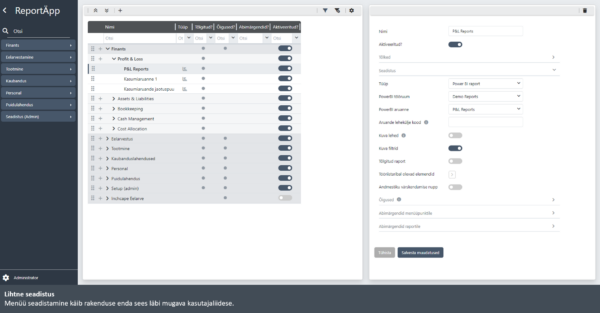
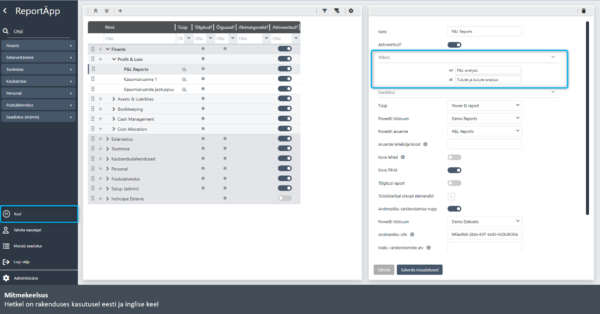
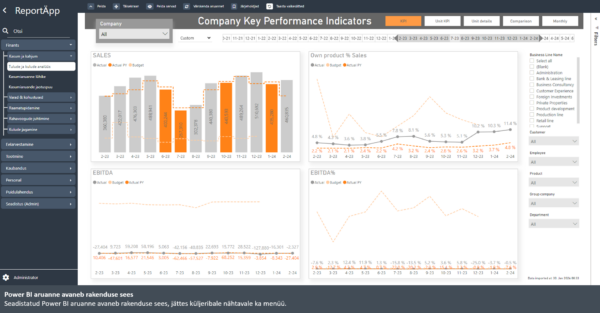
Check out sample reports in our gallery – click on an image to view it in full screen.
Contact Us

OIXIO Group
